Academic Salaries in Chemistry
My contract will expire in a year, and the slow turnover in academia means I need to start looking for my next job now (the year I got this post, only 3 jobs like it were advertised nationally). So I’m thinking a lot about things like career trajectory and salary, and I thought it might be interesting to look at the public HESA data as I do this.
Specifically, I’ve looked at the salary bracket data: how many people are paid between £X and £Y. HESA lets you pull this apart in ways which relate to certain protected characteristics and contract types, and I’ve done this for the Chemistry cost centre in the most recent available data (21-22 academic year).
Please note that HESA data operates on a ‘tombola’ rounding system: numbers are taken to the nearest 5 to preserve anonymity. This is particularly important because it can report numbers as zero when they are not, and make ‘spikier’ graphs for groups with small numbers of people in them.
The x-axis on all my graphs is the lower salary threshold for each of HESA’s reported brackets. I’ve normalised the data for each category, so the y-axis on all of my graphs is the % of the demographic category (e.g. the % of women who are salaried in each bracket). Please be aware that this obscures the under-representation of groups which is well documented elsewhere: there aren’t enough women in Chemistry, but my graphs are about how women are paid once they are already in Chemistry.
To help you judge the salary numbers, the UK median salary for a full-time worker in 2022 was £33,000. The RSC reports the average 2023 starting salary of a Chemistry graduate as £25,591 and the median salary of a Chemistry graduate responding to their annual salary survey as £46,700. PhD qualifications - which the vast majority of academic employees hold - are typically expected to boost earnings. Three years after graduation, first-degree chemists had 2020-21 median wage of £25,200 against £32,200 wages of PhD holders (though the salary sacrifice of low-paying PhD study is part of this story, too). Thinking more broadly, national economies have a big impact on salary, too; this C&EN article suggests PhD-holding Chemists in Switzerland earn more than twice what they might in the UK.
Warning: Data manipulation
I’ve done one piece of manipulation which is a bit cheeky, and want to be open about it. The HESA age data is split into five-year sections (e.g. 36-40 years old) and I have combined these categories into decades. My category “30s”, for example, adds the raw numbers for the HESA categories 31-35 and 36-40. You will notice that this is an imperfect fit (you are in your 30s if you are 30, and you aren’t in your 30s if you are 40), and that the ‘tombola’ rounding of HESA data makes my procedure somewhat inaccurate. Please be appropriately suspicious! I did it because a graph with five traces is much easier to read than ten.
All Contract Types
For Chemists in general - across every contract type - I’ve plotted the % of people in each salary bracket for various demographic slices.
The ethnicity data shows a relatively similar pattern for all groups in the lower salary brackets, but white Chemists are distributed more heavily to the higher brackets than other groups. The absolute under-representation of Black Chemists is worth stating clearly: HESA reports only 35 Black academics in Chemistry, roughly 1% of the population of all chemistry academics.

% of population by ethnicity in each HESA salary bracket across all contract types.
In the sex data, high-earning men are a bigger proportion of the male population than high-earning women are of the female population.

% of population by sex in each HESA salary bracket across all contract types.
Disabled Chemists are distributed fairly equitably over the first four salary brackets, and are under-represented in the highest bracket.

% of population by declared disability in each HESA salary bracket across all contract types.
The HESA data does not let us probe intersectional effects, but it seems plausible that the ethnicity, sex, and disability salary effects might compound each other.
The age data is the hardest graph to read. The clustering of salary outcomes moves up with age from low pay for Chemists in their 20s (black) to mid pay for Chemists in their 30s and 40s (magenta, green), to high pay for Chemists in their 50s and 60s+ (purple, lilac). Pay generally increases with age in most industries - whether due to experience or seniority.

% of population by age in each HESA salary bracket across all contract types.
Below I will perform the same four-graph analysis for different types of contract within the main data.
Research-only
Older people on research-only roles are paid more, and there seems to be a relatively smooth shift to higher salary brackets with age.

% of population by age in each HESA salary bracket in the research-only contract type.
What the age data obscures is that the research-only category is dominated by PDRA workers; there are numerically few research-only workers in the older age ranges. The standardisation of PDRA salaries results in relatively small pay gaps because pay clusters so narrowly in the third of HESA’s salary brackets. This gives the ethnicity, sex, and disability graphs a very distinctive form: the traces of all groups are very similar.
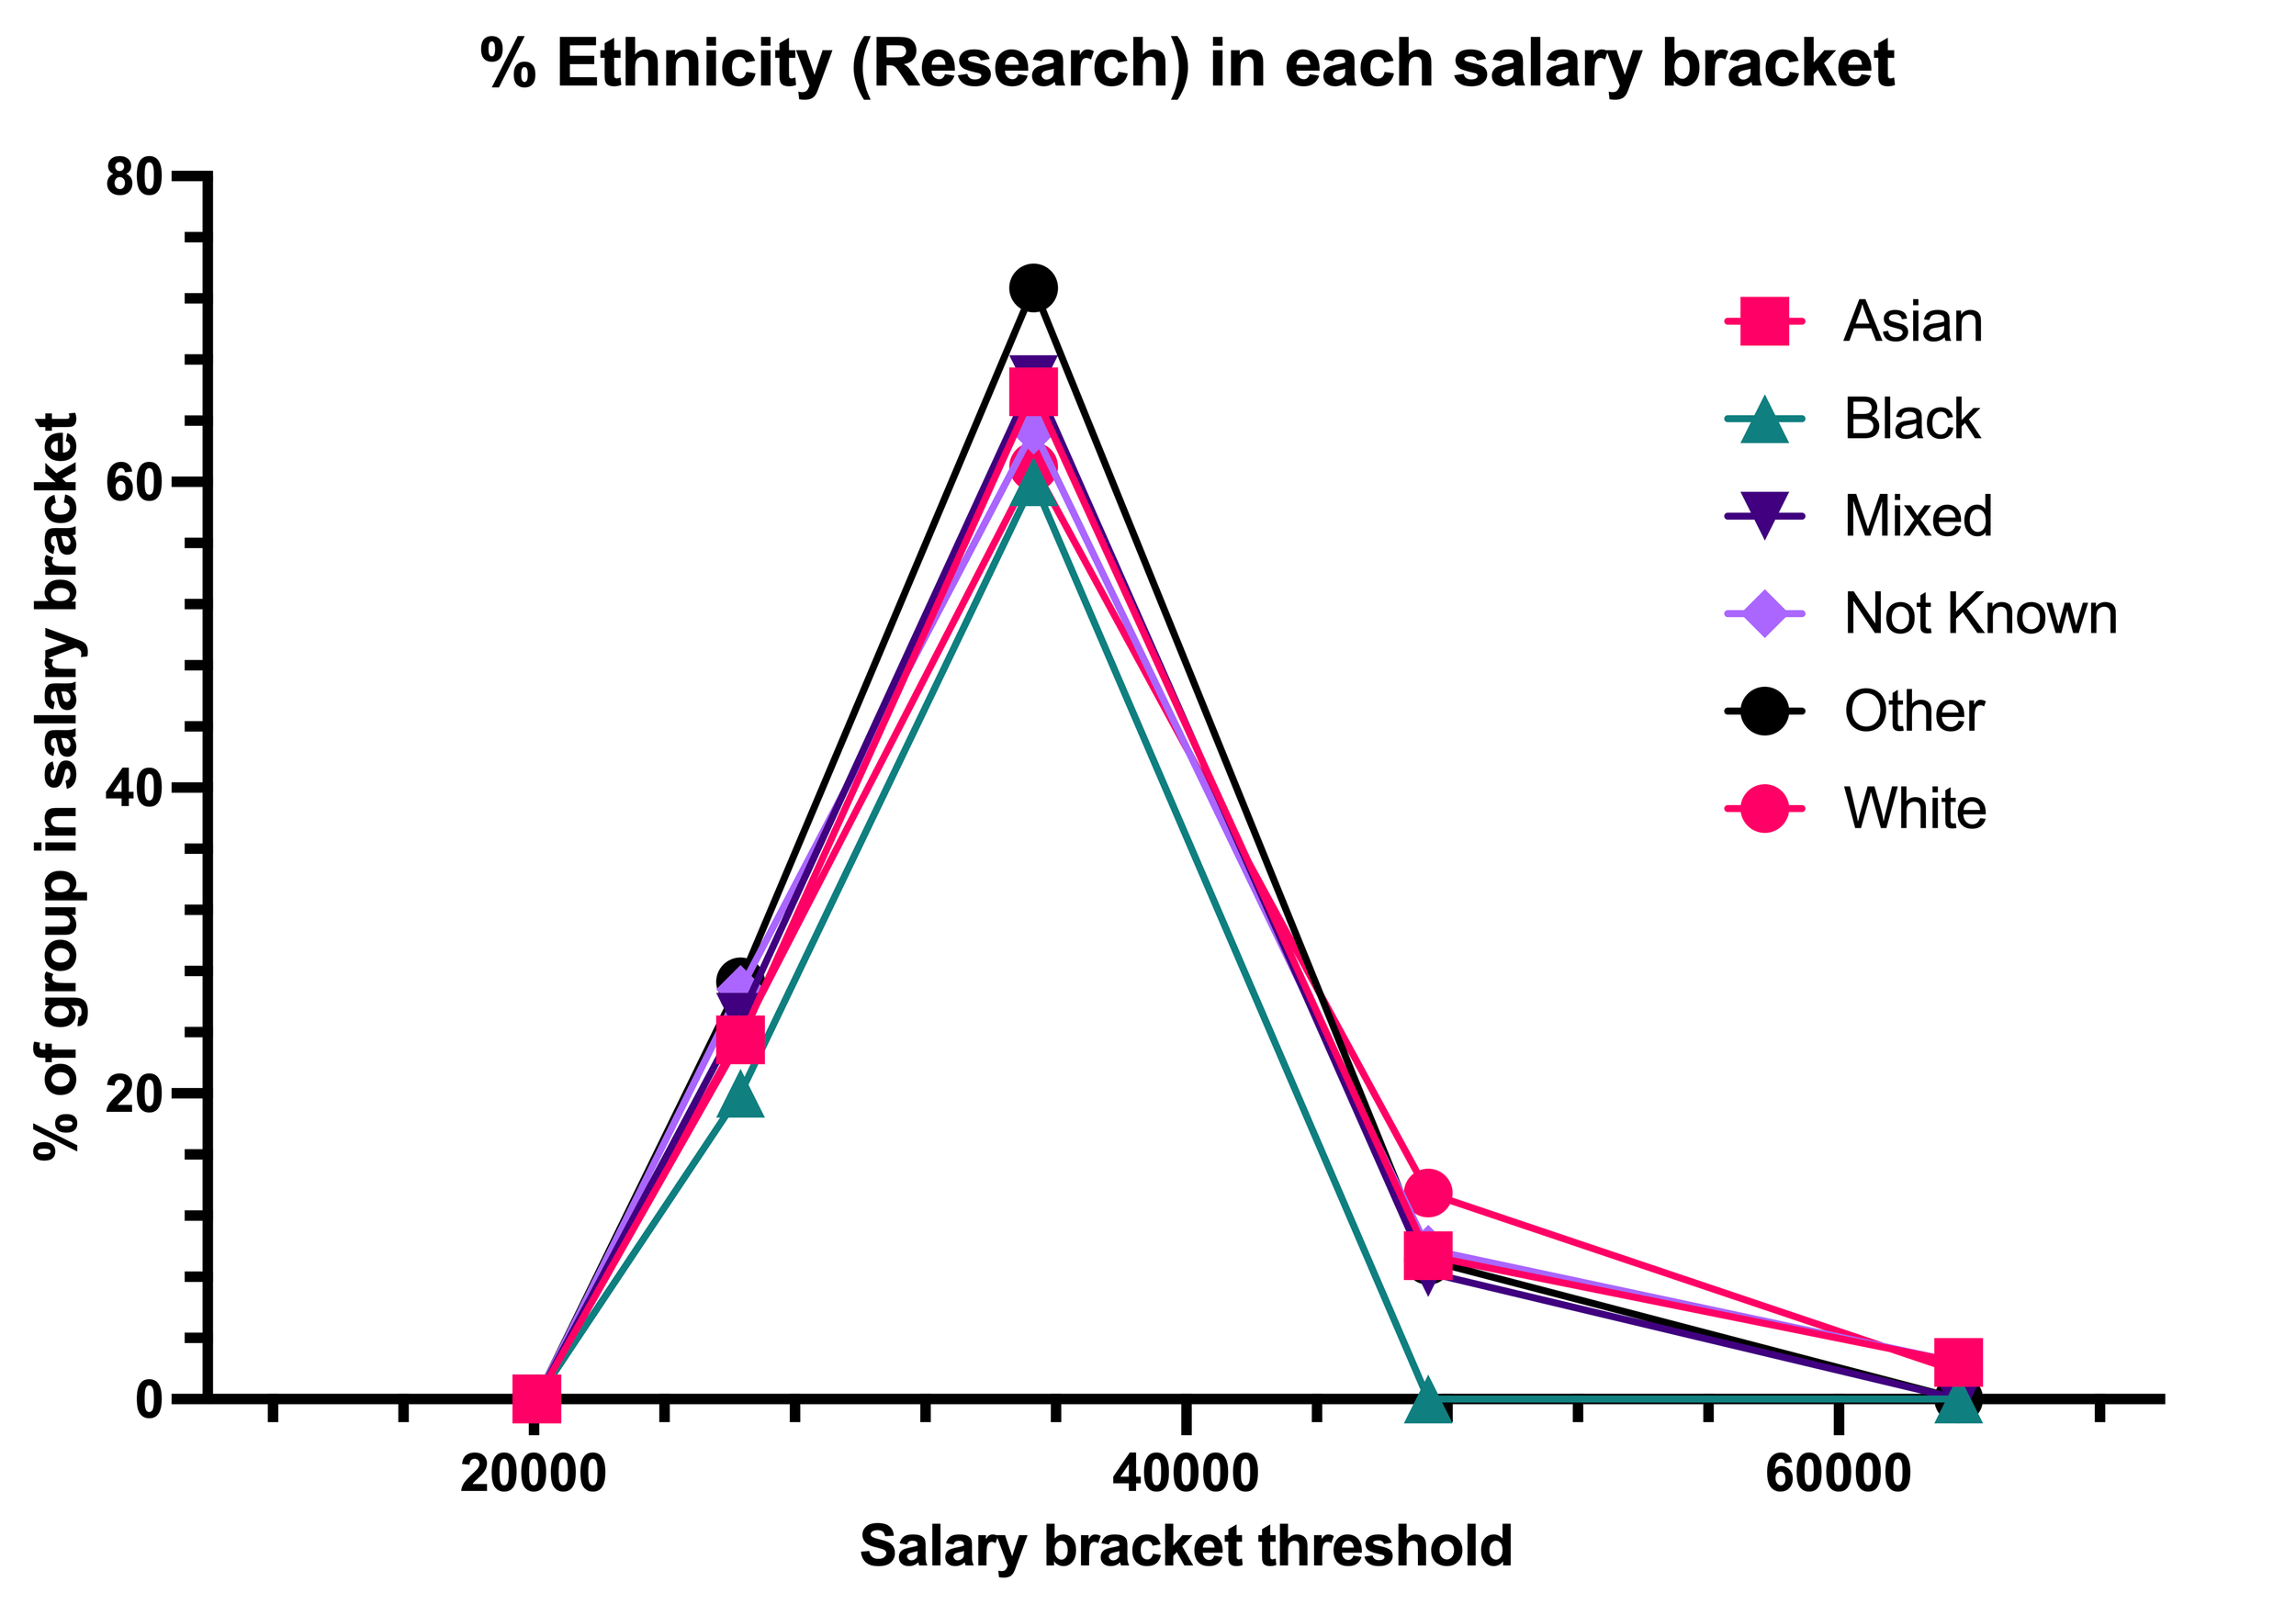
% of population by ethnicity in each HESA salary bracket in the research-only contract type.

% of population by sex in each HESA salary bracket in the research-only contract type.
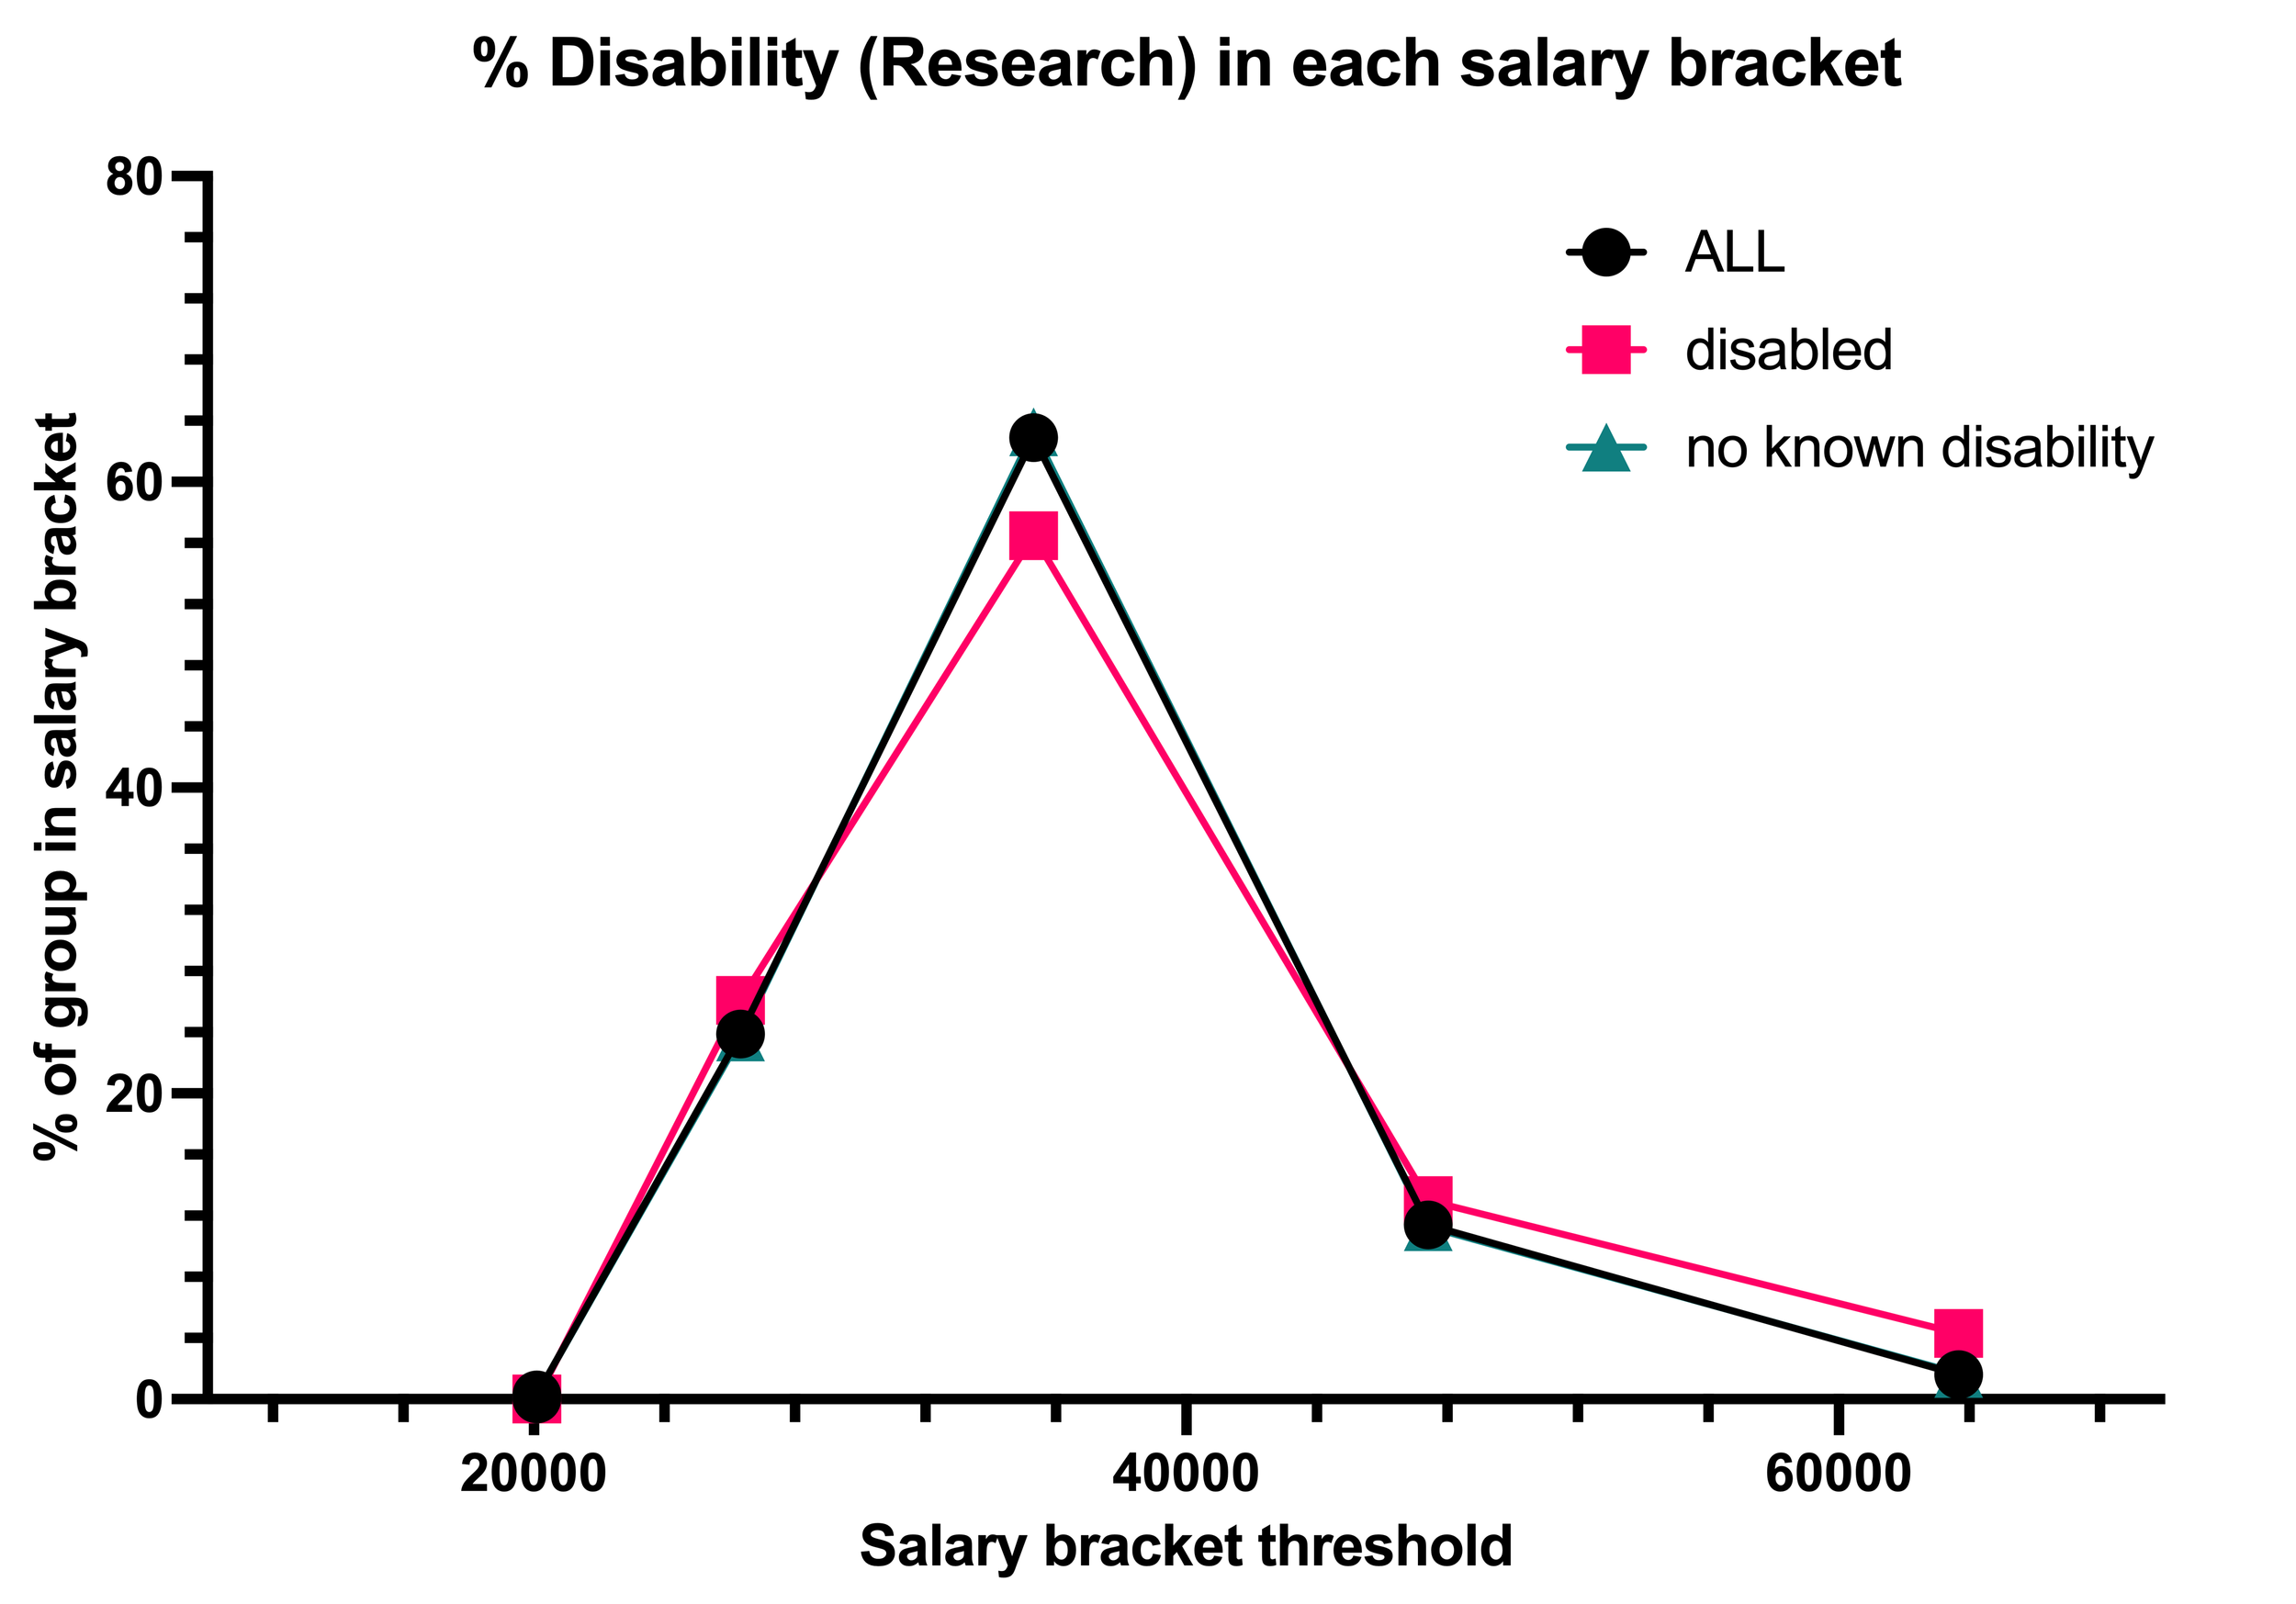
% of population by declared disability in each HESA salary bracket in the research-only contract type.
Teaching-only
The age distribution of salary brackets is loosely similar to the research-only traces, with the unusual exception of the 60s+ age range, which shows a curiously-flat trace. It seems that some of this is due to the low absolute number of older staff in teaching-only roles: each point is only five people (in the ‘tombola’ counting methodology).

% of population by age in each HESA salary bracket in the teaching-only contract type.
The distribution by sex shows that the fairly even distribution for the trace for all teaching-only staff hides the way men are paid more than women in the middle of the distribution.

% of population by sex in each HESA salary bracket in the teaching-only contract type.
The disability trace is hard to interpret too robustly, as the number of disabled staff is small: 20, by the ‘tombola’ methodology (around 6% of the teaching-only population). This observation invites questions about whether representation could be improved, either through recruitment or disclosure approaches.

% of population by declared disability in each HESA salary bracket in the teaching-only contract type.
The ethnicity data for teaching-only contracts again reflects the under-representation of Black Chemists. Other ethnicities show a much smoother distribution of salary brackets than the research-only or teaching-and-research data (see below).
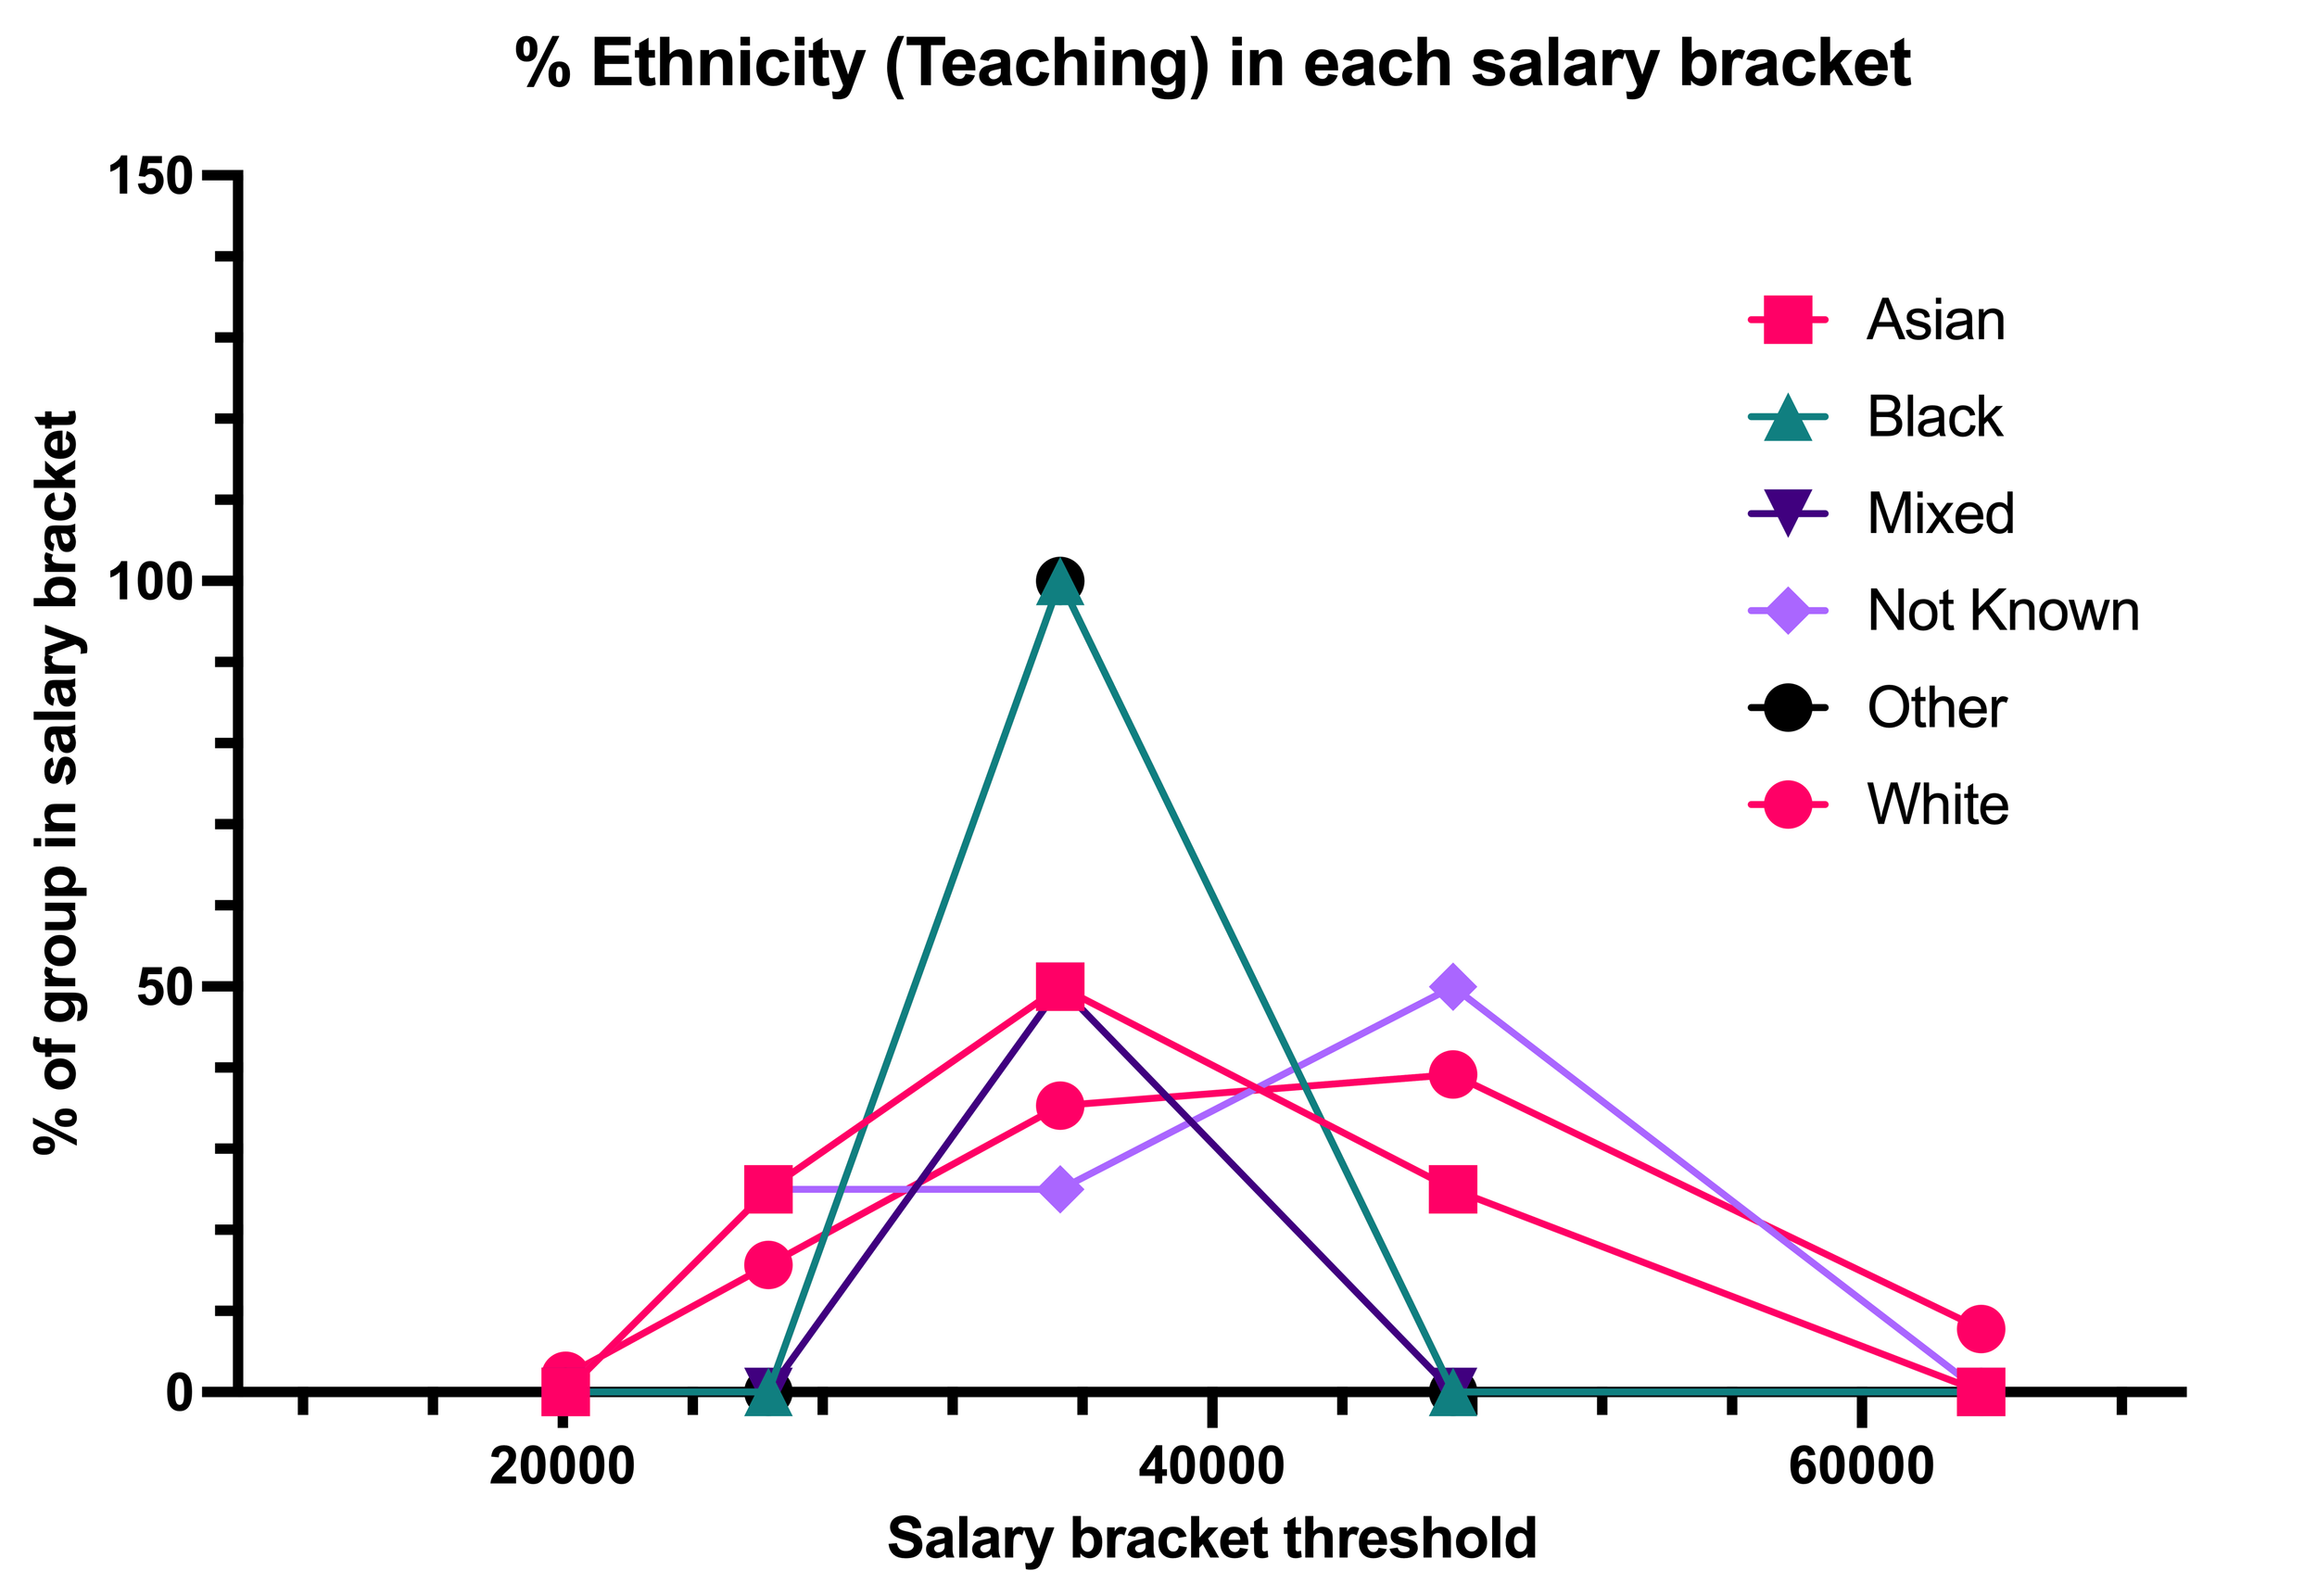
% of population by ethnicity in each HESA salary bracket in the teaching-only contract type.
Teaching and Research
The big difference seen in this data is that most of the traces for Teaching & Research contracts do not have a maximum: very well-paid Chemists on these contracts are normally the modal population.
In the age data, for example, the rapid progression of salary through Chemists 20s and 30s leaves 44% of Teaching & Research Chemists in their 40s in the highest HESA salary bracket; 77% of Chemists in their 50s and 85% in their 60s+ are on the highest pay.

% of population by age in each HESA salary bracket in the teaching & research contract type.
This pattern holds for men and Chemists with no declared disability, too, though women and Disabled Chemists are under-represented in the highest pay bracket. For the disability trace, it is possible that this reflects the low number of people (N = 55) declaring disability. While women are under-represented relative to men on Teaching & Research contracts (295 women vs 1090 men), the absolute numbers make it seem less likely that this pattern could be within error.

% of population by sex in each HESA salary bracket in the teaching & research contract type.

% of population by declared disability in each HESA salary bracket in the teaching & research contract type.
The ethnicity data is interesting because the ‘no maximum’ trend seen in the overall data is only observed for two groups: white and Other Chemists. 1,170 of the 1,380 Chemists in on Teaching & Research contracts are white, so this perhaps points again to absolute numbers obscuring the experiences of individuals in the aggregated data. Without intersectional analysis, it is hard to say whether this relates to age (it seems possible that old Chemists could be overwhelmingly white).

% of population by ethnicity in each HESA salary bracket in the teaching & research contract type.
Reflections on type of contract
It is a more selfish question than the analysis above, but a question I’ve always had is the comparison between teaching-only and teaching & research work. Sifting the data above into direct comparisons lets us see whether any given demographic group is paid better or worse in teaching-only roles. There is a lot of talk about “parity of esteem” between contract types. Does that esteem mean parity of pay?
I’ll leave some of the graphs below for you to judge for yourself. I’ve used black for teaching-only contracts and magenta for teaching & research contracts. For the age graph, I’ve only looked at the 30s and 40s as these are the most immediately relevant to me, and similarly for looking at only the white ethnicity category. I haven’t plotted the disability graph as I’m not confident it’s interpretable with such small absolute numbers.

% of population within the white ethnicity category in each HESA salary bracket in the teaching & research and teaching-only contract types.

% of population by sex in each HESA salary bracket in the teaching & research and teaching-only contract types.

% of population by selected age ranges in each HESA salary bracket in the teaching & research and teaching-only contract types.