Completion rates for STEM degrees
What are your chances of completing a degree once you start it? The answer to this question will depend on lots of things: you health, your wealth, your prior learning, your choice of modules. It will also - to some extent - depend on the subject you study. This blog focuses on differences in completion rate between STEM subjects.
The Office for Students produces a projection of your odds of completion, which it bases on the completion rate from recent years. CAH2 aggregation is done at the provider level, so you can look up the completion rate for a given (CAH2) subject at a specific University.
The limitations of the data are important to flag up: the main issue is that students who take time away from their studies but then return and succeed are not properly included in the completion rate. The numbers are very sensitive to how long a window you allow when considering the completion. The CAH2 aggregation is also slightly distinct from what a subject is. I’m also unclear how international students are processed in this analysis; the completion data collection being done in parallel with gathering graduate destinations data, and I’m not sure this is systematically collected for international students.
HEPI presents Sanderson’s case that the generally-high completion rates in the UK are part of the british model of recruiting students with a relatively low-risk of dropping out, and supporting students to finish their degrees. Some part of this is probably how Universities have historically influenced the secondary system; the radical specialisation involved in the (non-Scotland UK) model of taking 3 A Levels serves many Universities very well. The HEPI paper goes on to note that dropping out of study is not randomly distributed through the undergraduate population: certain groups (e.g. men, LGBT+ students, BAME students, disabled students, students with a BTEC background) are more likely to drop out.
This context is the arena in which most of the Widening Participation discourse plays out, and this is why I’ve been curious about continuation rates. The Sutton Trust/IFS report (see my blog post from December) took snapshot data at the point of entry and post-graduation employment - but what happens in the middle?
Completion Rates in STEM Subjects
I’ve plotted the completion rates by subject across the sector: the median bar is the University with the middle-ranked completion rate in each CAH2 category. As the data comes from the OfS, it does not cover all nations in the UK.

Sector-wide completion rates seem to vary substantially by STEM discipline. Medicine has the highest completion rates (median completion 97.1%); Computing has the lowest completion rates (median 73.8%). Chemistry (median 90.5%) fares quite well in this analysis, compared to other subjects: only one in eleven entrants doesn’t graduate.
Do the ranges tell you anything?
The ranges vary very widely, but it is hard to interpret them directly. For example, the narrow range of Medicine might reflect several plausible parameters: the small number of providers, the competitive bidding process for expanding (numbers-capped) places, the high entry tariff, the social capital of Medicine students.
Plotting the median score against the range (and interquartile range) shows a negative correlation, though the correlation coefficient is not overwhelmingly convincing. A strong correlation might have suggested something general is going on; this more-ambiguous result suggests that whatever the picture is, it’s more complicated.
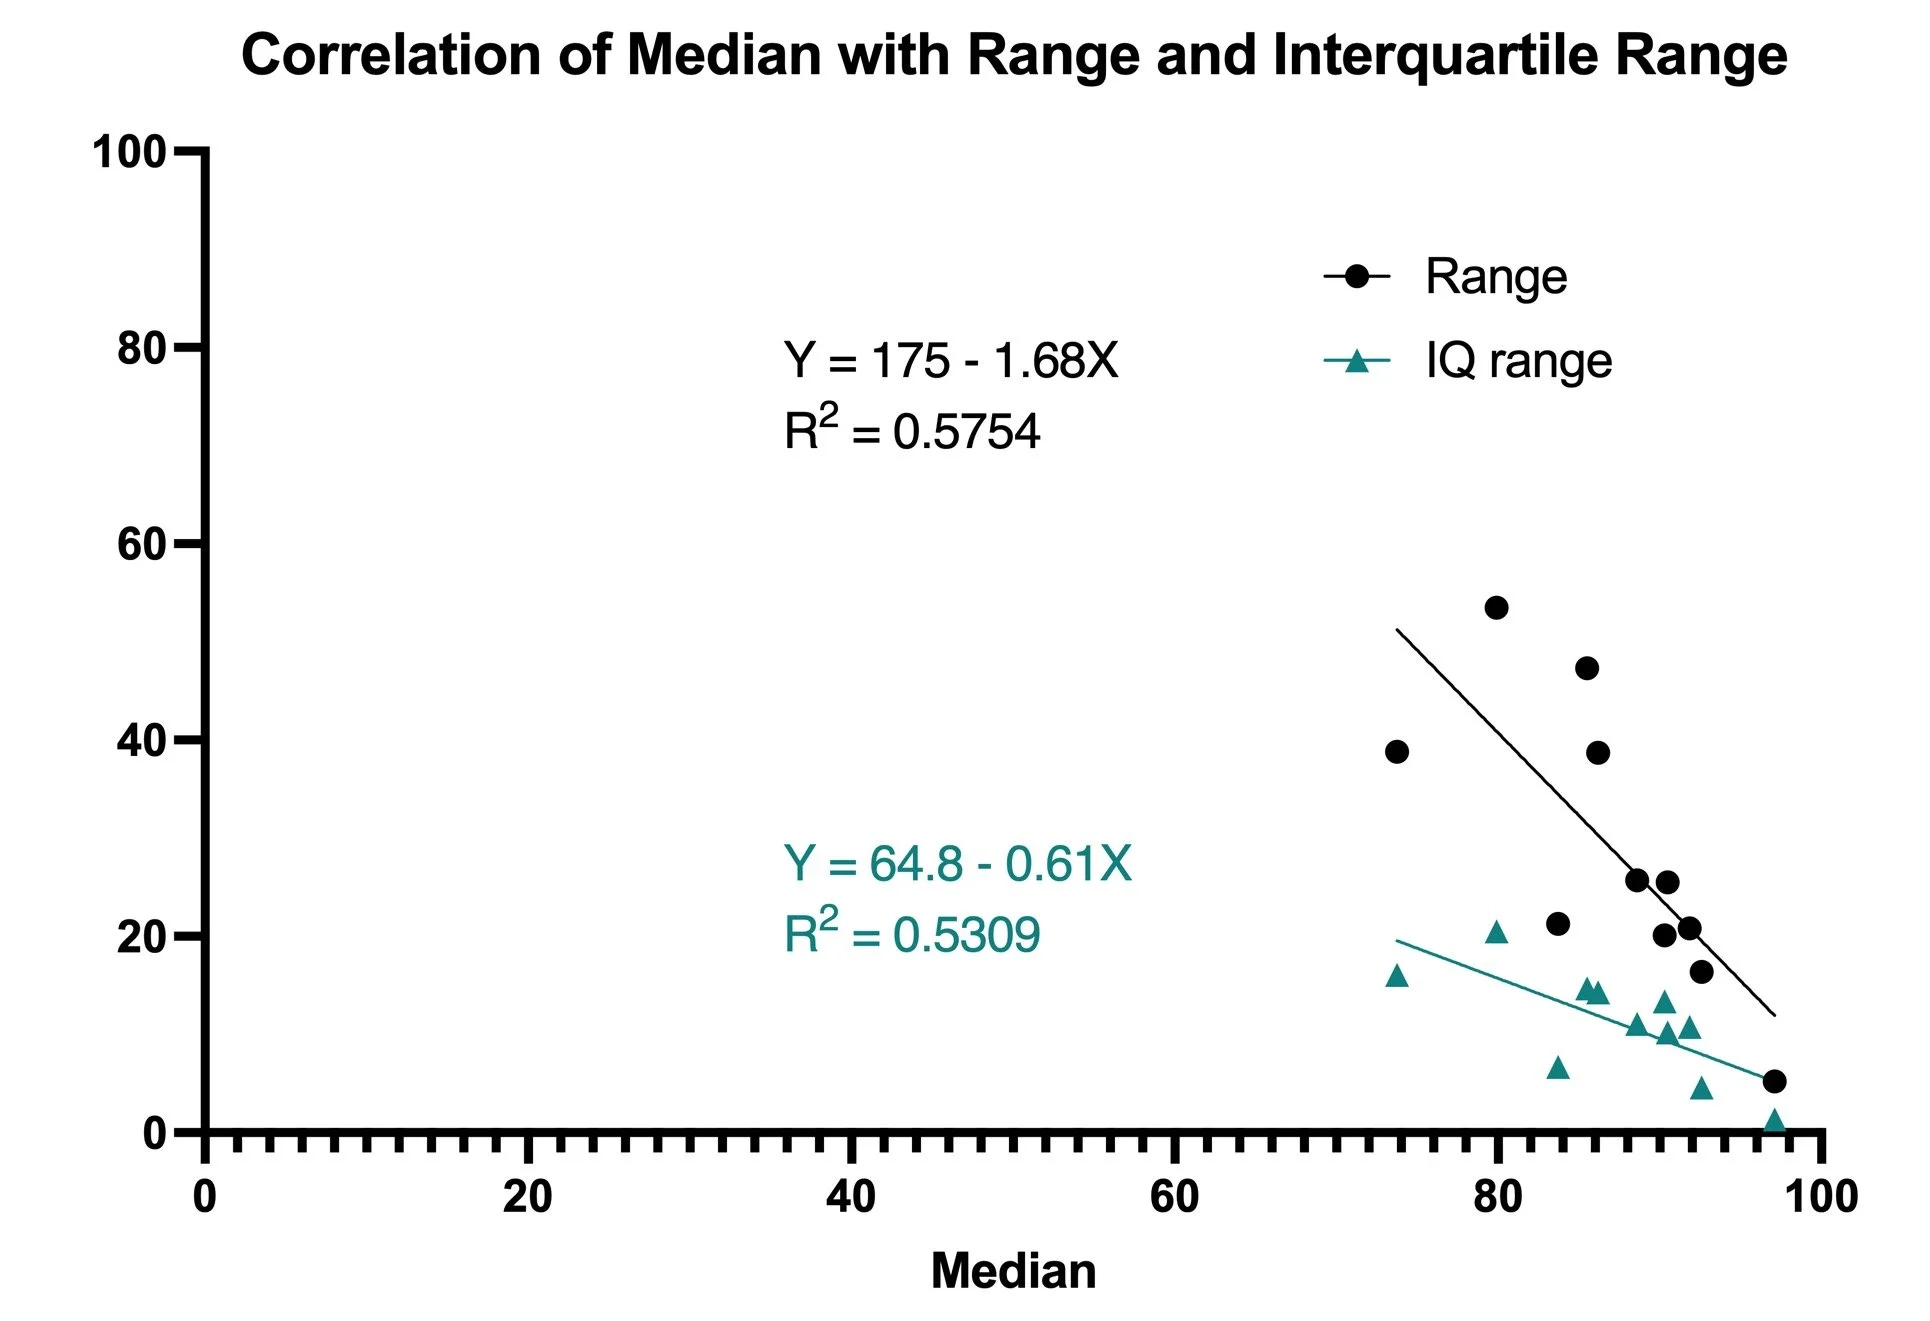
I was curious to plot this out because many STEM subjects are accredited by professional and regulatory bodies. You could speculate that the wide range of engineering completion rates might suggest that engineering accreditation serves to prevent people completing degrees, in contrast to what happens in medicine. It’s hard to claim that these graphs evidence that, though, and also hard to properly establish the counter-factual when comparing data between disciplines.
Oxford
I was curious about my own context, too. My students believe that Chemistry is the toughest degree in Oxford; are they right? I’ve plotted the projected completion rate (and standard deviation margin) for all reported subjects, grouping them by faculty.

Oxford’s completion rates overall are high, which seems consistent with the high prior attainment of students (and perhaps also the effectiveness of the signature tutorial pedagogy or the high assessment literacy of exams with the same format as A Levels).
Although completion rate (96.8%) is higher than for the sector overall (90.5%), Chemistry has the lowest reported completion rate in the Mathematical Physical and Life Sciences division. It is second-lowest in the reported University completion data after Geography, Earth, and Environmental Sciences (96.7%).
My students might be right; Chemistry is certainly one of the Oxford degrees which entrants are least likely to complete. This might somewhat reflect the (4-year) length of the degree but it may also be due to Chemistry-specific characteristics of the recruitment profile, curriculum, or assessment diet.